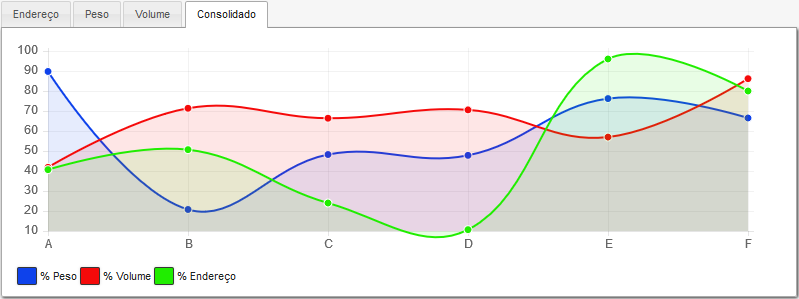
The W4R will be a tool that will aim to obtain strategic information for decision making and management based on the activities carried out and identified by a system of Warehouse Management System.
key Features
- Fully web access with the possibility OUT OF OFFICE;
- Flexibility for different types of organizations and platforms;
- Native integration with Datasul;
- Enable Mobile Access;
- Rapid deployment and no risk in the current operation. No need to stop the warehouse he works in parallel with the information from the WMS.
key Features
Mapping of warehouse costs through cost centers / business unit
- Direct Costs: Salaries, Equipment, Rental, Third, Time Extras, etc;
- Indirect Costs: Materials Office, Water, Light, IT, Security, etc.;
- Allocation and Apportionment of the operating costs of the warehouse;
- How much is my operation?
- Have a gain or loss?
Analysis of the capacity of the warehouse for several variables
- Total capacity and used in weight, volume and quantity;
- Inventory Turnover to confront my capacity for a period of time and the possibility of gain or loss;
- Capacity utilization (and used) operators based on average operation time thereof;
- Capacity utilization (and used) equipment based on the average time of operation thereof.
Generation statistics of the entire operation
- Average execution time per task;
- Average daily volume and loaded;
- Average weight and daily loads;
- Operator more efficient by time, volume and weight;
- Statistical operation monthly, daily and time;
- Idleness warehouse;
- Bottleneck warehouse
Panel managerial performance of warehouse processes
- Submission of daily charts;
- Top Productivity / Day
- Shipped Volume
- Monthly Income
- The interface should be dynamic and customizable
ABC classification of various visions of the warehouse
- Quantity Expedited / Busy;
- Volume Shipped / Busy;
- Shipped Weight / Busy;
- Value Shipped / Busy;
- Tasks dispatched / Bustling.
Comparison between organizations of the same segment in order to seek continuous improvement
- Comparative Example
COMPARATIVE |
COMPANY A |
MIDDLE MARKET |
POTENTIAL |
Inventory accuracy |
99,2% |
99,1% |
99,9% |
Giro stock (year) |
7,2 |
6,1 |
14,3 |
Warehouse occupation |
73,1% |
79,3% |
88,4% |
Idleness |
12,1% |
9,3% |
3,1% |
Tasks for Operator (days) |
63,2 |
79,8 |
89,9 |
Simulator decision making based on the information of the transaction
- Based on the information cost, space, time, equipment, labor, and other operating variables, assemble some scenarios that answer questions like the following:


